Trace Viewer
Tapsmith’s trace viewer records screenshots, view hierarchy snapshots, console output, and logcat at each test step, then lets you scrub through a timeline to debug failures. It’s the mobile-native equivalent of Playwright’s Trace Viewer.
Recording Traces
Section titled “Recording Traces”Via configuration
Section titled “Via configuration”Add trace to your tapsmith.config.ts:
import { defineConfig } from "tapsmith";
export default defineConfig({  trace: "on", // Record every test});
Via CLI
Section titled “Via CLI”Override the config with the --trace flag:
npx tapsmith test --trace onnpx tapsmith test --trace retain-on-failureVia programmatic API
Section titled “Via programmatic API”Control tracing within your tests:
import { test } from "tapsmith";
test("checkout flow", async ({ device }) => {  await device.tracing.start();
  device.tracing.group("Add to cart");  await device.getByText("Add to Cart", { exact: true }).tap();  device.tracing.groupEnd();
  await device.tracing.stop({ path: "traces/checkout.zip" });});
Trace Modes
Section titled “Trace Modes”| Mode | Records on | Keeps trace when |
|---|---|---|
off | Never | — |
on | Every attempt | Always |
on-first-retry | First retry only | Always (when recorded) |
on-all-retries | All retries | Always (when recorded) |
retain-on-failure | Every attempt | Test fails |
retain-on-first-failure | Every attempt | First attempt fails |
retain-on-failure-and-retries | Every attempt | Run fails or is a retry |
Recommended for CI: retain-on-failure — minimal overhead on passing tests, full diagnostics on failures. Use retain-on-failure-and-retries when you want to keep both the failing and passing runs of flaky tests for comparison.
Viewing Traces
Section titled “Viewing Traces”Online viewer
Section titled “Online viewer”Open trace.tapsmith.dev and drag a .zip trace file onto the page, or load one via the ?trace= URL parameter. The viewer runs entirely in your browser — no data is uploaded.
Local viewer
Section titled “Local viewer”npx tapsmith show-trace test-results/traces/trace-my_test.zipThis starts a local server and opens the trace viewer in your browser.
Trace Viewer Panels
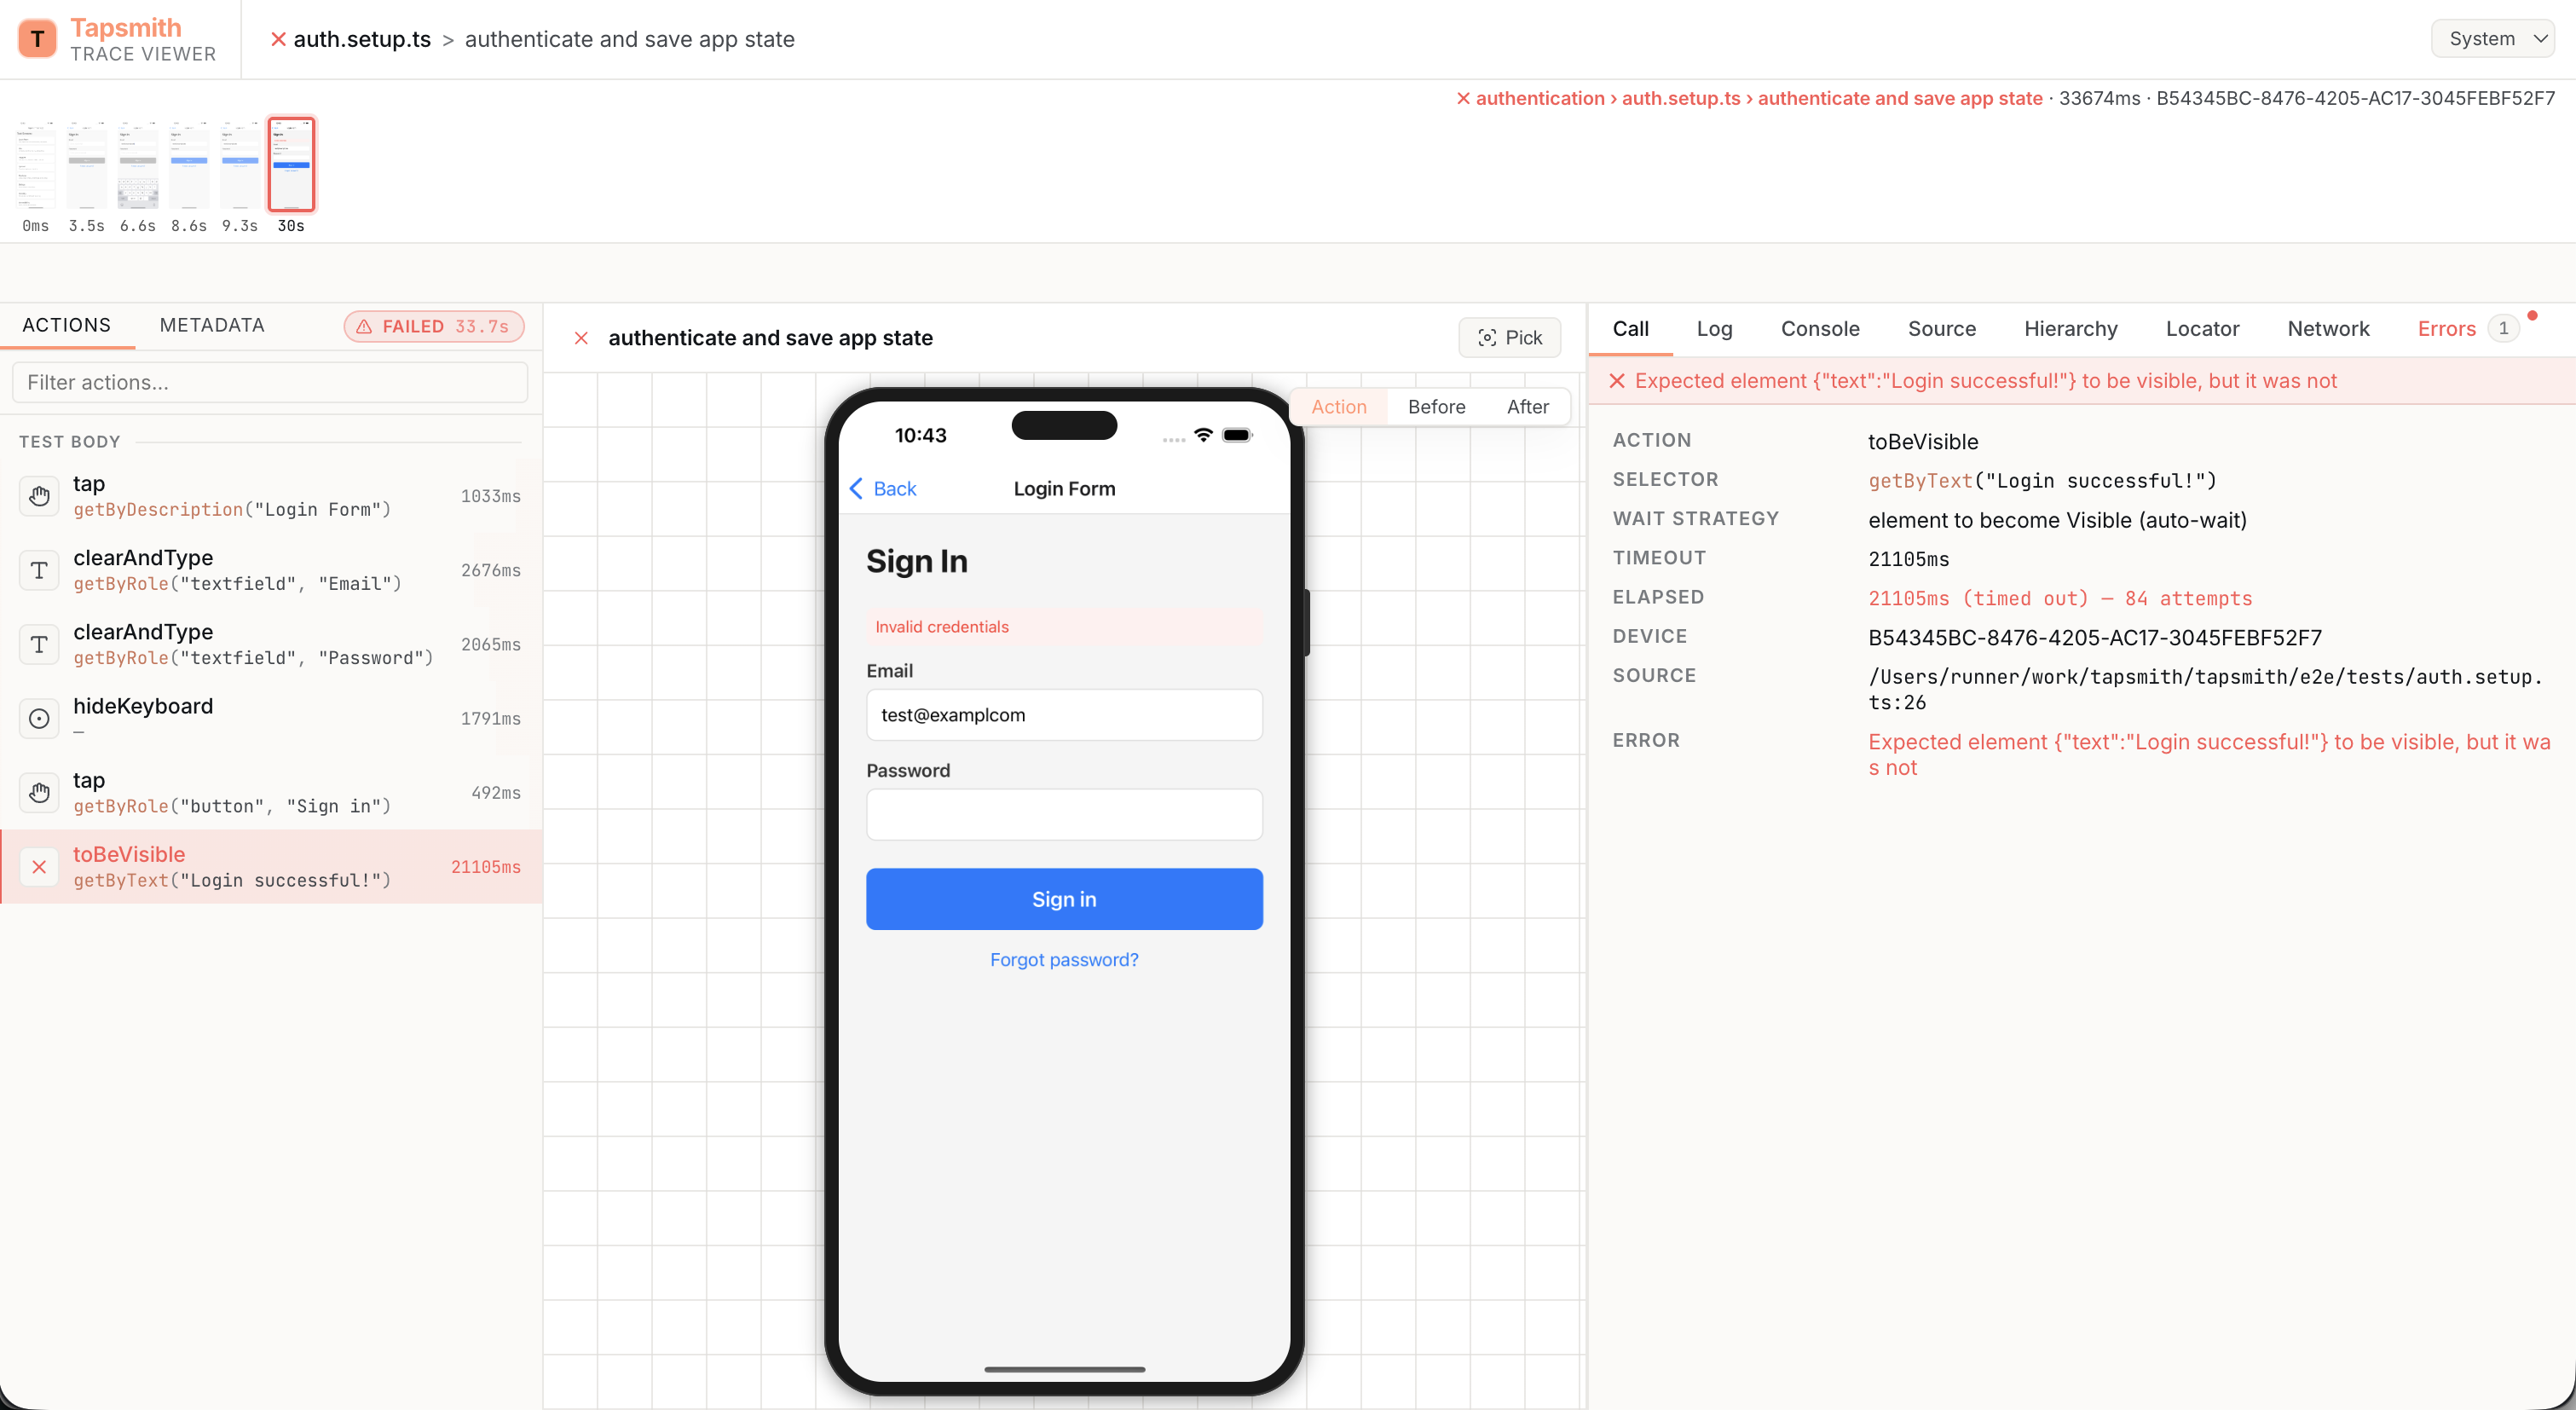
Section titled “Trace Viewer Panels”Actions Panel (left)
Section titled “Actions Panel (left)”Chronological list of all actions and assertions. Each entry shows:
- Action icon and name (tap, type, swipe, etc.)
- Selector used
- Wall-clock duration in milliseconds, including time between trace actions
- Pass/fail status (red highlight for failures)
Groups from device.tracing.group() appear as collapsible sections.
Keyboard navigation: Use arrow keys or j/k to move between actions.
Timeline Filmstrip (top)
Section titled “Timeline Filmstrip (top)”Horizontal strip of screenshot thumbnails. Click to jump to an action. Failed actions have a red border.
Screenshot Panel (center)
Section titled “Screenshot Panel (center)”Shows before/after screenshots for the selected action:
- Before — screenshot taken before the action executed
- Action — before screenshot with tap/swipe coordinate overlay
- After — screenshot taken after the action completed
Detail Tabs (right)
Section titled “Detail Tabs (right)”- Call — Action type, selector, bounds, wall time, raw action/assertion time, wait time, retry count
- Console — Test code
console.log/warn/errorand device logcat output, color-coded by level - Source — The actual source file for the selected step — test, helper, page object, or fixture — with the relevant line highlighted. When a step has a multi-frame call stack, a clickable call-stack pane lets you walk up the stack and view each frame’s file. Files are captured at run time, so the code shown matches what actually ran even if you edit afterwards.
- Hierarchy — Android view hierarchy XML with searchable tree view
- Network — HTTP requests captured during the test (see Network Capture below)
- Errors — Error message, stack trace, and assertion expected/actual values
Network Capture
Section titled “Network Capture”Tapsmith can capture HTTP/HTTPS traffic from the device during test execution. Network requests are recorded alongside other trace data and displayed in the trace viewer’s Network tab.
Enabling network capture
Section titled “Enabling network capture”Network capture is enabled by default when tracing is active. Control it with the network field in TraceConfig:
import { defineConfig } from "tapsmith";
export default defineConfig({  trace: {    mode: "retain-on-failure",    network: true, // default — capture HTTP traffic  },});
To disable network capture while keeping other trace features:
trace: { mode: "on", network: false,}How it works
Section titled “How it works”When network capture is enabled, the Rust daemon starts a local MITM proxy and routes the device’s traffic through it. Each request and response is recorded with method, URL, headers, status code, timing, and body data.
Android — the daemon uses adb reverse to forward the proxy port to the device and configures the device’s HTTP proxy setting via adb shell settings put global http_proxy.
iOS simulator — the daemon spawns the Mitmproxy Redirector.app launcher (from a local brew install mitmproxy), which triggers the macOS Network Extension that ships with mitmproxy. The NE intercepts TCP flows from the simulator’s process tree on a per-PID basis and redirects them into Tapsmith’s MITM proxy over a per-worker Unix socket. Parallel iOS workers each get their own isolated session. See iOS network capture for first-run setup (one-time System Extension approval) and troubleshooting.
iOS physical device — not yet supported; follow-up work.
HTTPS support: The proxy auto-generates a CA certificate and installs it on the device so it can decrypt TLS traffic. For simulators this happens transparently via xcrun simctl keychain add-root-cert; for Android it is pushed via adb. The client’s TLS ClientHello SNI is extracted at MITM time so the upstream TLS handshake uses the real hostname (critical for CDN-hosted endpoints).
Network tab in the trace viewer
Section titled “Network tab in the trace viewer”The Network tab shows a sortable table of all captured requests:
| Column | Description |
|---|---|
| Method | HTTP method (GET, POST, PUT, etc.) |
| URL | Full request URL |
| Status | HTTP status code, color-coded (green for 2xx, blue for 3xx, yellow for 4xx, red for 5xx) |
| Type | Shortened content type (json, html, text, etc.) |
| Duration | Time from request start to response end |
| Size | Response body size |
Click a row to expand it and see full details:
- Request headers and response headers
- Request body and response body (JSON bodies are pretty-printed)
Use the filter bar to search by URL and the status buttons (All / 2XX / 3XX / 4XX / 5XX) to narrow results. Click column headers to sort.
Trace Archive Format
Section titled “Trace Archive Format”Traces are stored as .zip files containing:
trace.zip/ metadata.json # Device, test, version info trace.json # NDJSON event log screenshots/ # PNGs (action-003-before.png, action-003-after.png) hierarchy/ # View hierarchy XML snapshots sources.json # Source files referenced by step call stacks, keyed by absolute path network.json # NDJSON network request log (when network capture is enabled) network/ # Large request/response body filesThe format uses version: 1 for forward compatibility.
CI Integration
Section titled “CI Integration”Capturing traces in GitHub Actions
Section titled “Capturing traces in GitHub Actions”- name: Run tests run: npx tapsmith test --trace retain-on-failure
- name: Upload traces if: failure() uses: actions/upload-artifact@v4 with: name: tapsmith-traces path: tapsmith-results/traces/ retention-days: 30Viewing CI traces
Section titled “Viewing CI traces”Download the trace artifact from your CI run and open it locally:
npx tapsmith show-trace tapsmith-results/traces/trace-login_test.zipOr open trace.tapsmith.dev and drop the downloaded .zip file onto the page.
Deep Linking
Section titled “Deep Linking”The trace viewer supports URL parameters for sharing specific views:
?trace=https://example.com/trace.zip— load a trace from a URL?action=5— jump to the 5th action
For example: https://trace.tapsmith.dev?trace=https%3A%2F%2Fexample.com%2Fartifacts%2Ftrace.zip&action=5